RPE Calculator
RTS-based training weight planning, guided by Rate of Perceived Exertion.
Maximum you can lift for 1 clean rep
Maximum you can lift for 1 clean rep
Weight you lifted in the set to estimate from
Enter your inputs and press Calculate to see results.
Most lifters I coach hit a wall with traditional percentage-based programs because a plan written weeks ago cannot know your daily readiness on the day you actually lift. That is where Rate of Perceived Exertion changes the conversation, asking about proximity to failure instead of assuming a fixed weight will always fit. Developed for lifters by Mike Tuchscherer through Reactive Training Systems, this modern lifting scale translates reps in reserve into a number you can act on immediately. Calling a top set RPE 8 means you had 2 reps in reserve, while RPE 10 means no reps left in the tank and nothing honest remained for another Wilks Score attempt.
This calculator does the arithmetic behind that call, turning one honest set into an estimated one-rep max and an e1RM you can compare across weeks without testing a true maximum. From there it back-solves the precise weight to load for your next attempt under the bar, whether you work in kilograms or Imperial pounds and need quick switching units at home or away. Because One Rep Max fluctuates daily, it helps you autoregulate rather than chase a number that belonged to a better-rested, better-fed version of you. Everything runs client-side with all calculations run entirely in your browser, no data is sent to any server, and the point stays simple: honest effort, translated into workable load, supports steadier long-term progress.
What the RPE Calculator Does
| Feature | What it does |
|---|---|
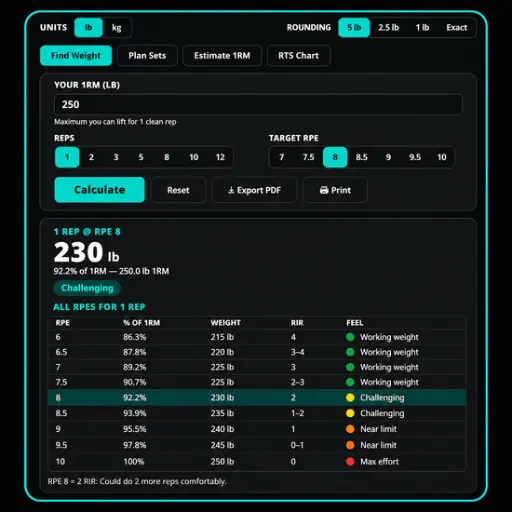
| 🏋️ Find Weight | Enter 1RM, reps, and target RPE: get the exact training weight to load. |
| 📋 Plan Sets | Generate a full per-set weight plan with fatigue modelling across a block. |
| 📊 Estimate 1RM | Enter a recent set’s weight, reps, and RPE: estimate your true one rep max . |
| 📐 RTS Chart | Full 12×9 RTS percentage table, live-updating, with optional weights overlaid. |
| ⚙️ Rounding | lb or kg-appropriate increments, or exact for unrounded values. |
| 📍 Rep/RPE Quick Selects | Segmented buttons for all valid reps (1–12) and RPE values (6–10 in 0.5 steps). |
| 💪 Set Status Labels | Each RPE level is labelled: Working Weight, Challenging, Near Limit, Max Effort. |
| 📖 RIR Reference | Accordion mapping every RPE value to Reps in Reserve. |
| ⚠️ High-RPE Warning | Plan Sets warns when any set reaches RPE 9.5–10. |
| ⚠️ Low-RPE Warning | Estimate 1RM warns when RPE is below 8 (less accurate at lower intensities). |
| 📄 PDF Export | In-browser PDF for every mode; no server, no upload. |
| Clean print view of current results. | |
| 🔗 Cross-Link | Link to the One Rep Max Calculator for formula-based one rep max estimation. |
| 📱 Mobile-Friendly | Fully responsive layout on any screen size. |
| ♿ Accessible | Keyboard navigable, ARIA-compatible, visible focus indicators. |
What Is RPE? The Foundation of this Calculator
Rate of Perceived Exertion in Strength Training
I learned this the hard way on mornings when true strength fluctuates with poor sleep, accumulated stress, and low readiness, yet the programme still expected the same output. Rate of Perceived Exertion is, in plain terms, how hard a set felt on a 1 to 10 scale, not how impressive the load looked to anyone watching.
RPE vs. Reps in Reserve (RIR)
That leftover count is your reps in reserve, shortened to RIR, and it is why coaches teach the shortcut RPE = 10 minus RIR instead of asking for a long explanation after a hard set. Unlike a fixed percentage written weeks earlier, this call lets you autoregulate training loads to the body that actually showed up today and to protect the intended effort of the session. In practice I treat one single calibrated set as the evidence, because a good RPE calculator relies on the lifter’s calibration more than on any heroic guess about what should have happened. That is also why the system self-corrects: the same training prescription can stay in place while the weight shifts, as long as daily readiness is read honestly before you start.
The RPE Scale: 6 to 10 Explained
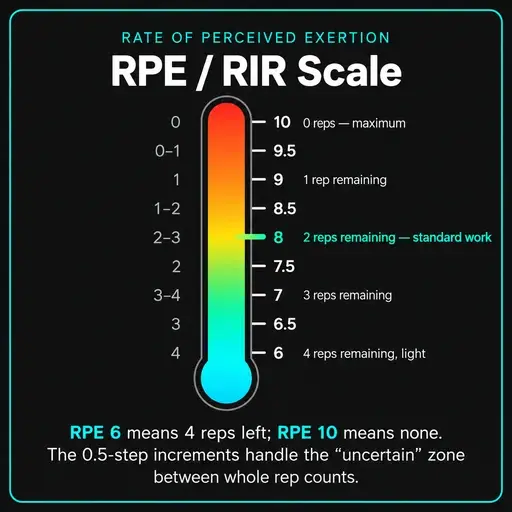
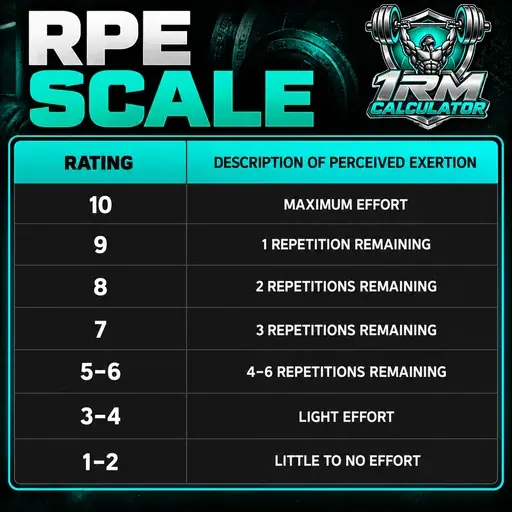
RPE 10 = 0 reps left means maximum effort, the point where you could not do one more rep with anything honest left. Drop down the scale and the maths stays personal: RPE 9 = 1 rep left, RPE 8 = 2 reps left, RPE 7 = 3 reps left, and lower still you have approximately 4 reps remaining.
Why RPE-Based Training Outperforms Fixed Percentages
Fixed-percentage programming rests on a flawed assumption: that your strength remains constant from day to day. It does not. A tested one rep max of 315 lb is merely a snapshot from your best day, not a permanent ceiling. After a week of poor sleep, missed meals, and accumulated fatigue, that same lifter’s true maximum may have fallen to 290 lb, yet the program still demands its prescribed load. What was written as “80% of 315 lb” on paper can therefore feel like a 90%+ effort in practice, turning a planned moderate session into an unintended near-maximal grind. RPE programming reverses this logic entirely: instead of forcing your body to fit a predetermined number, it prescribes the effort and lets the weight adjust to your readiness on that day. This is not guesswork, it is evidence-based autoregulation, with research by Zourdos et al. (2016) confirming RPE as a valid and reliable measure of training intensity in competitive powerlifters.
| RPE | RIR | Description |
|---|---|---|
| 10 | 0 | Maximum: couldn’t do another rep |
| 9.5 | 0–1 | Could barely attempt one more |
| 9 | 1 | Could do exactly 1 more rep |
| 8.5 | 1–2 | Uncertain about 1 or 2 more |
| 8 | 2 | Could do 2 more reps comfortably |
| 7.5 | 2–3 | Uncertain about 2 or 3 more |
| 7 | 3 | Could do 3 more reps |
| 6.5 | 3–4 | Uncertain about 3 or 4 more |
| 6 | 4 | Could do 4 more reps, fairly light |
The RTS Table: The Methodology Behind This Calculator
| Reps | RPE 6 | RPE 7 | RPE 8 | RPE 9 | RPE 10 |
|---|---|---|---|---|---|
| 1 | 86.3% | 89.2% | 92.2% | 95.5% | 100% |
| 3 | 80.8% | 83.5% | 86.3% | 89.2% | 92.2% |
| 5 | 75.1% | 78.0% | 81.1% | 83.5% | 86.3% |
| 8 | 66.7% | 69.4% | 72.3% | 75.1% | 78.0% |
| 10 | 61.3% | 64.0% | 66.7% | 69.4% | 72.3% |
| 12 | 56.1% | 58.7% | 61.3% | 64.0% | 66.7% |
The complete 12×9 RTS chart, with every 0.5-step RPE value, is available in RTS Chart mode above.
How to use the RPE Calculator?
Train by effort, not by guesswork. The RPE Calculator turns your target reps and effort level into an exact working weight, using the Reactive Training Systems (RTS) percentage table developed by Mike Tuchscherer.
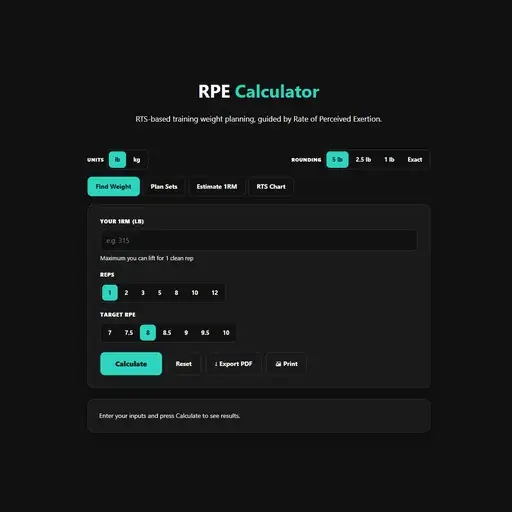
Step 1: Select Units and Enter Your 1RM
Start by choosing lb or kg, then enter your tested one-rep max. Changing the unit updates the labels only, it does not convert the number you entered, so always check your value after switching. The calc accepts a One Rep Max up to 2,000 in either unit. If you do not have a tested one rep max yet, use Estimate One Rep Max mode to calculate one from a recent multi-rep set.
Step 2: Choose a Rounding Option
Select how the final weight should be rounded for real gym loading. Standard rounds to 5 lb / 2.5 kg for most commercial gyms, Fine rounds to 2.5 lb / 1.25 kg for fractional plates, Minimal rounds to 1 lb / 1 kg for precision loading, and Exact gives the unrounded value for programming and spreadsheets. Your choice applies consistently across all modes.
Step 3: Select Your Mode
Find Weight: You know your reps and target RPE, and you want to know what to load.
Plan Sets: You are programming multiple sets and want to account for fatigue building from set to set.
Estimate one rep max : You have completed a set and want to work backwards to predict your One Rep Max.
RTS Chart: You want to explore the full percentage table before you decide on a load.
Step 4: Set Reps and RPE Using Quick-Select Buttons
Use the quick-select buttons for speed, or type your own value. Reps cover 1 to 12, and RPE covers 6 to 10 in 0.5 steps, covering the full RTS range. If you type a standard value, its button highlights automatically.
RPE to percentage chart: reps and RPE to %1RM.
I learned to read the full RPE chart backwards, starting from the target RPE and the rep count I actually want, rather than hunting for a weight first. On this page that grid works as a browsable RTS Chart and a standard RPE/RIR chart at once, so scrolling the chart rows lets me check every combination before I touch the bar. The axes in the standard RTS percentage table stay deliberately practical rep count (1–12) on one side and RPE (6–10 in 0.5 steps) on the other which is why half-point RPEs get their own place instead of being rounded away. Read it as a lookup table first and a conversion table second, because the RPE × reps intersection gives you the percentage of one rep max before any Calc multiplies the percentage by your max.
The examples stick because they are concrete: 3 reps at RPE 8 sits at about 86%, close to the 86.3% figure paired with a 3-rep set at the top end. Compare that with a 5-rep set at 81.1% of One Rep Max, or 8 reps at RPE 9 at only about 74%, and the same effort suddenly means a very different load. That shift is why I teach RPE 9 as 1 rep in reserve and use RPE = 10 – RIR as shorthand, because RPE 10 means 0 reps in reserve with nothing left to argue about. In practice I keep the printed RPE chart as an RPE × reps × load chart, check the full 12×9 table once, and then save the RTS Chart PDF for the gym wall.
| Reps \ RPE | 10 | 9.5 | 9 | 8.5 | 8 | 7.5 | 7 | 6.5 | 6 |
|---|---|---|---|---|---|---|---|---|---|
| 1 | 100% | 98% | 96% | 94% | 92% | 91% | 89% | 88% | 86% |
| 2 | 96% | 94% | 92% | 91% | 89% | 88% | 86% | 85% | 84% |
| 3 | 92% | 91% | 89% | 88% | 86% | 85% | 84% | 82% | 81% |
| 4 | 89% | 88% | 86% | 85% | 84% | 82% | 81% | 80% | 79% |
| 5 | 86% | 85% | 84% | 82% | 81% | 80% | 79% | 77% | 76% |
| 6 | 84% | 82% | 81% | 80% | 79% | 77% | 76% | 75% | 74% |
| 8 | 79% | 77% | 76% | 75% | 74% | 72% | 71% | 69% | 68% |
| 10 | 74% | 72% | 71% | 69% | 68% | 67% | 65% | 64% | 63% |
Read across: each cell is the percentage of your one rep max you’d expect to lift for that many reps at that RPE. RPE 10 = 0 reps in reserve; each half-point down adds about half a rep in the tank.
Rate of Perceived Exertion (RPE) vs. Percentage Based Training (PBT)
In my own programming I stopped arguing that one system wins, because neither is strictly better what changed results was learning to blend the two instead of defending a fixed plan. A daily prescription built from a tested max looks tidy on paper, yet a programme built on percentage-based plans and fixed loads simply ignores daily readiness on the mornings sleep and work have already beaten you up. RPE self-corrects for readiness because it autoregulates in real time on a strong day I will add weight to hit the same RPE, not just repeat the number written last month. On a flat day the honest move is to back off once fatigue shows up, because a purely fixed percentage of your one rep max fails me when the bar does not care what the spreadsheet promised.
That is why my default in practice is planning in % one rep max for structure and enforcing with RPE in the session for truth, taking the percentage as a starting point and letting me cap it with an RPE before ego takes over. Without that cap, tired lifters will grind past the intended effort chasing kilos, especially when prepping for a meet or programming for a roster where nobody wants to be the one who went lighter. Even experienced coaches I work with audit this weekly, because the method only holds for lifters who can call effort accurately and it quietly breaks when honesty about perceived exertion drifts after a hard week. Used that way, RPE does not replace percentages it lets you autoregulate load inside them, protecting strength gains on bad days without wasting the good ones and keeping the load honest to the goals of that block.
Plan Sets Mode: Fatigue Modelling Across Your Block
Fixed Weight Style: The RPE Rises as You Fatigue
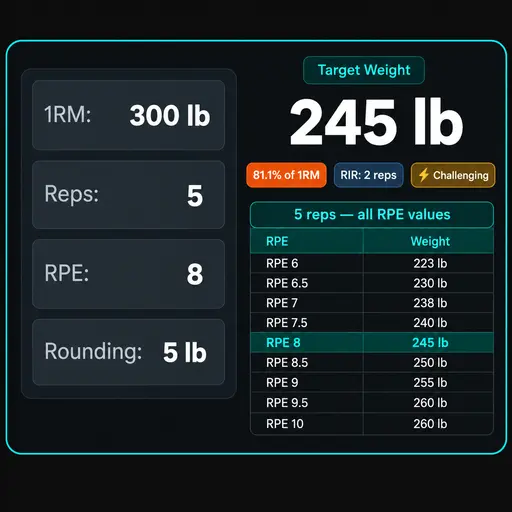
In Fixed Weight style, the bar stays loaded the same for every set. As fatigue accumulates, that identical weight feels heavier, so the RPE climbs from set to set. The fatigue % is divided by 10 to set the RPE rise per set 3% fatigue means roughly +0.3 RPE per set, snapped to the nearest 0.5. Starting at RPE 8 with 3% fatigue across 3 sets gives Set 1 at RPE 8, Set 2 at RPE 8.5, and Set 3 at RPE 9, all at 245 lb (based on a 300 lb one rep max ). The load never changes; the effort does.
Fixed RPE Style: The Weight Drops as You Fatigue
In Fixed RPE style, the effort stays constant and the weight gives way instead. The Calc lowers your effective one rep max by the fatigue factor each set, then re-solves the weight for your target RPE against that reduced ceiling adjusted one rep max = one rep max × (1 − fatigue%) compounded per set. With 3% fatigue across 3 sets at RPE 8 for 5 reps, that works out to Set 1 at 245 lb, Set 2 at 240 lb, and Set 3 at 235 lb, every set held at RPE 8. You trade load to protect the intended effort.
Setting the Fatigue Percentage
In Plan Sets, the fatigue percentage controls how the complete multi-set weight plan assumes fatigue accumulates from one set to the next. It works inside the fatigue modelling alongside your starting RPE and number of sets, so a higher value makes the weight drop faster to keep the effort honest. Set it too low and later sets quietly become Fixed Weight in disguise the RPE rises past target, and what looked tidy on screen turns into grinding in real training. Raise it too high and you underload multiple sets of back-off work, even though the first set in the plan was spot on and you arrived well-rested. The calc accepts 0–8% per set.
From experience, the right setting depends less on the exercise name and more on actual accumulation, because real fatigue varies with rest time, sleep, and exercise selection. Remember, fatigue % is a modelling assumption shaped by individual variation: two lifters using the same fatigue percentage per set for squats and bench will rarely fatigue at the same rate. If the top set was already in the near-maximal zone, do not just reduce the fatigue % also consider whether to reduce the number of sets before fatigue turns sloppy. I usually start conservative, watch whether fatigue accumulating across sets matches the prediction over a block, and only tighten the percentage once the pattern repeats under a Fixed RPE target.
The High-RPE Warning
plan calls for RPE 9–10 work that is essentially near-maximal effort on a day you are quietly under-recovered. That is the zone of a genuine max-effort set at RPE 9, with one rep left in the tank if you are honest, and close to failure even if the bar still moves. Push one notch higher to RPE 9.5 or 10 and the cost changes quickly, especially after a set where form broke down, because recovery is compromised and the next session pays for it. At true RPE 10 you could not complete another rep with good form, so what looks like effort is often just technical failure dressed up as intensity. When any set reaches RPE 9.5 or 10, the tool warns you: ensure you are rested and have a spotter.
That is why I tell lifters to avoid training at RPE 10 frequently and to keep most working sets below that line, where practice at calling effort can actually accumulate. In most strength programmes, the rule that most sets should be RPE 7–9 is already a ceiling, not a floor, and the standard intensity for repeatable work sits lower still. Keeping 1–3 reps in reserve, or choosing RPE 7–8 and deciding to leave 1–2 reps in the tank, stops grinding from becoming the default style of your working sets. Even experienced lifters who can hit RPE 9 reliably treat a set that feels like RPE 9.5 as a signal to back off once fatigue starts distorting the call.
Estimate 1RM Mode: Find Your Max from Any Training Set
How the Reverse RTS Calculation Works
I reach for Estimate one rep max mode right after a recent top set, because it converts that set into an e one rep max an estimated one rep max from the weight and reps you actually performed. The calculation itself is plain: the RTS table is read in reverse, so e1RM = weight ÷ percentage. If the table says 5 reps at RPE 8 = 81.1% of one rep max , then a 243 lb squat for 5 reps at RPE 8 gives 243 ÷ 0.811 ≈ 300 lb. I treat this as a practical way to track strength without testing a true one rep max every block.
This is a different estimation method from the Epley and Brzycki formulas in the main one rep max calculator. Instead of estimating from rep count alone, it uses your subjective effort rating to contextualize the estimate on a day when the weight moved harder than usual, the RPE reflects that, and a formula using only reps cannot.
When RPE-Based Estimation Is Most Accurate
From my own logs it is most accurate at RPE 8–10 in 1–5 rep sets, where trained lifters usually land within 2–5% of a measured max. That consistency is earned, not automatic: they rate RPE consistently because a calibrated RPE built over a year or more of conscious effort tracking changes how honestly a set gets called.
I only log a call assessed immediately after the set, with the effort still fresh, because delayed guesses rarely produce reliable ratings once the bar is racked and breathing settles. The low-RPE warning is there for a reason: below 8, less experienced lifters routinely underestimate effort, and that error inflates the predicted one rep max on paper. At lower RPE values the same problem compounds, as small errors stretch into larger errors even though the RTS percentage table was validated on thousands of lifters. It stays more accurate at low reps because you are closer to a true one rep max and can judge actual proximity to failure cleanly, while high-rep RPE calls drift a limit built into a table calibrated on trained powerlifters, not beginners guessing under fatigue.
Compared to Formula-Based 1RM Estimation
The main one rep max calculator estimates one rep max from reps alone, with no RPE input. If you did 5 reps at RPE 9, a formula only estimate cannot know you were working harder than usual the RPE-based estimate can. Compare the two outputs: when they land close together, your RPE calibration is sound; a large gap is a sign the rating needs adjusting. You can cross-check either estimate against percentage based training loads with the % of one rep max calc.
Export, Print, and Take Your RPE Plan to the Gym
Export to PDF
The sheet I tape inside my gym bag starts as a PDF export from this free RPE calculator, because a printed plan never dies mid-session the way a phone propped against the platform does. That export is generated client-side by a small JavaScript engine, so no data is sent to any server and no account is required to make it the file saves as rpe-training.pdf right in your browser. It also runs with no external library dependencies and stays fully functional offline, which matters when the gym Wi-Fi drops and I still need a clean copy before I lift. Because the math is deterministic, I get the same sheet every time I reprint it, right down to each percentage of one rep max , and a simple note that RPE 8 means 2 left keeps the notation honest in the gym.
Each mode generates its own PDF: Find Weight gives the target weight, RPE, % of one rep max , RIR, and the full row table; Plan Sets lists every set with its weight, RPE, and RIR; Estimate one rep max records the input set and the estimated one rep max ; and the RTS Chart exports the full 12×9 table in whichever view percentage or weight is on screen. In practice I build two versions: one from Find Weight when I only need what to load for a single set, and one from Plan Sets when the whole session needs laying out in advance. The first gives me one training weight tied to a target RPE, while the second lays out predicted loads that progress sensibly from one next set to the next. The Plan Sets PDF is the one I actually carry it shows exactly what to load per set, with no tool needed mid session.
I check the target weights against the displayed weight on screen before printing, then round to nearest 0.5% so the numbers match plates I can actually load rather than theoretical decimals. A typical printed line might read 5 reps × 3 sets at RPE 8, with the working weight and its exact weight after rounding noted beside the target load, so loading the bar is fast and I never have to recalculate between sets.
Clicking Print opens the browser’s print dialog with a stylesheet that hides the Calc UI and renders a clean, ink-friendly version of the current result “Save as PDF” in the dialog works as an alternative to the Export button. For the RTS Chart, the print view renders the full table in a format suited to coaching boards or binder reference sheets.
Technical Notes and Limitations
Validation Rules
All computation runs client-side in JavaScript no data is sent to any server. The engine is deterministic: identical inputs always produce identical outputs. For background on the one rep max input, see the One Rep Max Basics guide.
| Input | Rule |
|---|---|
| 1RM | Finite positive number; maximum 2,000 (any unit) |
| Reps | Integer 1–12 |
| RPE | One of: 6, 6.5, 7, 7.5, 8, 8.5, 9, 9.5, 10 |
| Sets (Plan Sets) | Integer 1–6 |
| Fatigue % (Plan Sets) | Number 0–8 |
| Weight (Estimate one rep max) | Finite positive number; maximum 2,000 |
All errors display inline beneath the Calculate button; no alerts, no page reload.
Limitations of RPE-Based Programming
In my own logs, the first limitation is easy to miss: the tool does not measure anything, it simply looks up the Tuchscherer multiplier table, and where a call falls between entries, the value is interpolated from the nearest rep/RPE combination. That lookup is fixed once published, but your input is a variable input a subjective effort rating attached to a target rep count so the output can only be as stable as that rating. In the chart, each cell is a cross-reference built from different datasets, which is why small variations appear between published tables even when the method looks identical. I therefore treat any predicted one rep max as a rough starting point, not a precise estimate, especially when the set was below RPE 8 and the margin for a misread is widest.
Accuracy holds up best in 1–5 reps and at a low rep count more generally, because proximity to your strength limit makes the call harder to fake. The picture changes above 8 reps, as perceived effort climbs faster under building lactate, laboured breath and slipping grip. That is also where perceived effort drifts most in my experience: a set logged as RPE 7 can prove to be really RPE 8.5 once you honestly assess how the actual set moves on video. Individual variation is real here too the RTS table is calibrated on trained powerlifters, and beginners may find their numbers differ by ±5–10%, because RPE calibration is a skill that develops with training experience and coaching feedback. And the fatigue % in Plan Sets is a modelling assumption: it approximates actual accumulation, while real fatigue varies by rest time, training age, and exercise selection. None of this makes the tool useless for experienced lifters who rate effort accurately and keep their RPE calibration honest block to block, it stays a reliable guide, just never a substitute for an actual one rep max test.