All Formulas 1RM Calculator
Compare all 7 one-rep max formulas in one place accuracy ratings, key details, and your estimated strength range.
YOUR LIFT
The weight you lifted for the set.
Used to highlight the best-validated formula for your lift.
Early programs I wrote leaned on single-formula calculator output; hidden uncertainty stayed invisible until real-world error derailed planned deadlift work. Watching spread within seven formulas taught me reserving trustworthy status until numbers survive heavy loading scrutiny. I treat Epley as universal standard dating to 1985, though most accurate claims collapse outside low rep counts where precision truly lives. Mayhew earned a 1RM bench press specialist reputation, but using it elsewhere demands caution I learned through trial.
O'Conner gives conservative floor through simplest math, while Wathan offers balanced default behavior I find most consistently accurate. Chasing most defensible estimate means respecting validity limits instead of forcing purpose-built tools outside tightest zone. My research base stays calibrated by comparing estimates directly inside training log entries spanning mesocycles. Experience proves no single formula suits all lifters; averaging quiets dot-plot spread, restoring confidence within RPE Calculator program design.
What the All Formulas 1RM Calculator Does
| Feature | What it does |
|---|---|
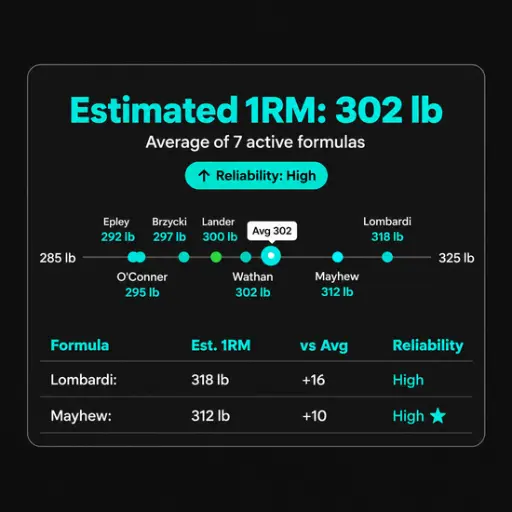
| 📊 Average 1RM Hero | Large primary display: the average across all active formulas, rounded to your selected increment. |
| 📊 Dot-Plot Spread | The horizontal axis shows every formula as a dot: the tighter the cluster, the more trustworthy the estimate. |
| 🏷️ Overall Reliability Badge | High / Moderate / Low / Poor based on rep count across all active formulas. |
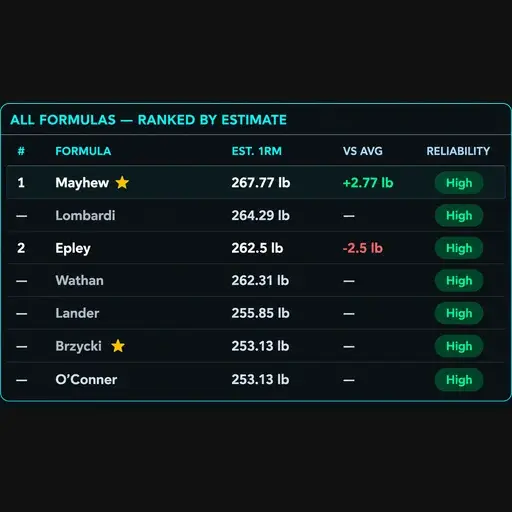
| 📋 Ranked Table | All 7 formulas ranked by estimate with vs-average deviation and per-formula reliability columns. |
| ⭐ Exercise Recommendations | Star badges on formulas are best validated for your selected exercise. |
| 💊 Formula Toggle Pills | Activate or deactivate any formula: average and dot-plot update live. |
| 💡 Recommendation Pill | Shows which formulas are best validated for your exercise and rep count after calculating. |
| 📖 Per-Formula Reliability | Each formula rated at your entered rep count: High / Moderate / Low / Outside. |
| 🎯 Exercise Selector | Back Squat, Bench Press, Deadlift, Overhead Press, and General: controls which formulas are starred. |
| ⚡ Rep Quick-Select | One-click buttons for 1, 3, 5, 6, 8, 10, 12, 15, 20 reps. |
| ⚙️ Rounding Options | 5 lb / 2.5 lb / 1 lb / Exact (lb) or 2.5 kg / 1.25 kg / 1 kg / Exact (kg). |
| ⚖️ Units | lb or kg toggle. |
| 📚 About the Formulas Accordion | Author, year, best use case, and notes for each of the 7 formulas. |
| ❓ Which Formula Accordion? | Guidance on formula selection by rep range and exercise. |
| ↗️ Cross-Link | Direct link to the % of 1RM Calculator for planning training weights after estimating. |
| 📄 PDF Export | Full results: ranked table, spread statistics, reliability, recommendations; all client-side. |
Compare all 7 one-rep max formulas with a visual spread chart and interactive toggles to see how estimates differ, identify consensus ranges, and choose more informed training weights.
Why Compare All Seven Formulas at Once?
The Problem with Single-Formula Tools
Most one-rep-max calculators suffer from a fundamental methodological flaw: they rely on a single predictive equation, typically Epley, and present its output as a definitive estimate. In reality, predictive accuracy is never inherent to a formula itself; it is conditional on the lift, the rep range, and the population on which the equation was calibrated. Epley’s linear model performs reliably for squats in the 3–8 rep range, yet loses precision outside that window. Mayhew was derived specifically from bench-press data, making it lift-specific rather than universal. Brzycki, meanwhile, demonstrates strong accuracy at 1–5 reps but its predictive validity deteriorates markedly as repetitions increase. A tool that commits to only one of these models therefore makes an unstated assumption, that its chosen equation happens to match your lift, your rep scheme, and your training profile, an assumption that is frequently incorrect. True accuracy does not come from selecting one formula and trusting it blindly; it comes from comparing multiple validated models and understanding where each one performs best.
The Case for the Consensus Average
The consensus average is used as the primary result for a deliberate statistical reason: no single equation consistently outperforms the rest, so relying on one model exposes the estimate to that model’s inherent bias. By averaging seven independently derived formulas, each built from different datasets, populations, and mathematical assumptions, the influence of any individual error is systematically diluted rather than amplified. When models developed through entirely separate approaches converge on a similar value, that agreement itself becomes a powerful signal of reliability, far stronger than the authority of any one prediction standing alone. Extensive validation research confirms this principle, showing that leadership among formulas shifts with lift, rep range, and lifter characteristics, with no permanent winner. The average is therefore not a compromise or a fallback; it is the most robust, evidence-based default for an estimate you can actually trust.
When Formulas Agree and When They Don’t
Predictive precision is fundamentally rep-dependent: the formulas converge most tightly at low repetitions and separate progressively as the rep count rises. At just 3 reps, all seven models typically fall within 2–3% of one another, producing an average that can be trusted with a high degree of confidence. Beyond 8 reps, however, that consensus begins to break down, and by 12 or more reps it can widen substantially. This is not a failure of the mathematics alone; at higher repetitions, individual physiology takes over, with differences in fast-twitch versus slow-twitch dominance, strength endurance, training history, and current fatigue meaning the identical weight and rep count can correspond to markedly different true maxima for different lifters. That is precisely why the dot plot matters: it transforms abstract uncertainty into an immediate visual signal, showing at a glance whether the estimate is tight and dependable or wide and provisional. The spread should therefore never be dismissed as background noise; it is actionable intelligence that tells you when to trust the average, when to treat it as a range, and when to retest with a heavier, lower-rep set for a far more reliable result.
How to Read the Dot Plot?
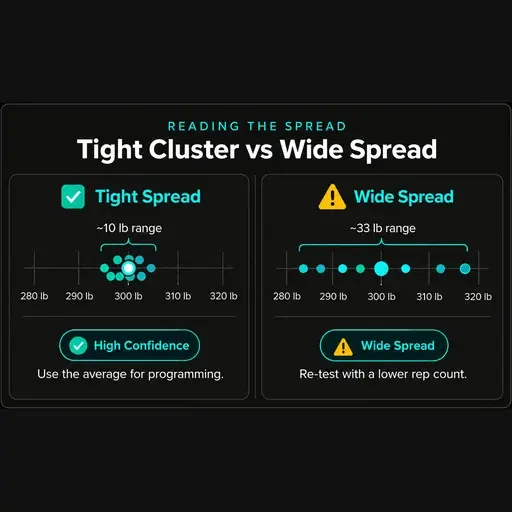
The dot plot translates complex statistical agreement into a single, instantly readable visual: a horizontal weight scale on which every active formula is plotted as a distinct coloured dot at its precise estimated value. The consensus average is distinguished as a slightly larger orange marker, anchoring the eye to the central estimate around which all other predictions are arranged. Formulas you have deactivated are not removed entirely; they appear as faded, muted dots, preserving full context by showing where they would have fallen without allowing them to influence the calculation. The true insight, however, lies in the distance between the outermost dots: that visual span is the spread, a direct measure of disagreement. A tight, compact cluster signals strong alignment across independently derived models and therefore a highly dependable estimate, while a wide, scattered distribution warns you immediately that confidence should be lower and the result treated with greater caution.
Tight Spread vs Wide Spread: What Each Means
| Spread | Threshold | Meaning | Action |
|---|---|---|---|
| Narrow | below 5% or below 5 lb | Formulas broadly agree: consensus is reliable. | Use the average confidently for programming. |
| Medium | 5–15% or 5–15 lb | Normal variation: average is reasonable. | Use the average; note individual formula recommendations. |
| Wide | above 15% or above 15 lb | Significant formula divergence | Treat the average as a rough estimate; retest with a lower rep count. |
A wide spread is usually caused by a 12+ rep set. Retest with 3–5 reps at a challenging but controlled intensity, where all seven formulas converge and the spread collapses into a far more reliable estimate.
Using Spread to Calibrate Confidence
Often low rep counts give me tight cluster readings where numbers broadly agree, while heavier attempts create wide spread moments where they openly disagree. I stopped chasing average outputs without knowing its systematic bias, because leaning on any single formula prevents honest calibration. My rule now: re-test using lower-rep set efforts until numbers agree within 5 lb; that usually lands more reliable estimate territory. 1985 gave us two landmark equations, released during same year; today they converge closely inside 1–5 reps yet split between different populations.
My deadlift numbers versus my bench press numbers diverge significantly; strength endurance variation remains dominant factor here. I keep lowest plausible estimate thinking as my conservative floor reference, using anchor with other planning anchors. Before sharing results with my coach, I check spread statistics tucked inside my formatted summary to sense how hard sets actually feel. I treat ±5–10% as my working ceiling because fatigue state plus individual variation beats any directly tested 1RM fantasy.
The Seven Formulas: Complete Reference
| Formula | Author | Year | Type | Best For | Valid Range |
|---|---|---|---|---|---|
| Epley | Boyd Epley | 1985 | Linear additive (r/30) | General; squat; deadlift | 1–12 reps |
| Brzycki | Matt Brzycki | 1993 | Linear denominator | Low reps (1–5); bench press | 1–10 reps |
| Lander | J. Lander | 1985 | Linear denominator | Moderate rep ranges (6–10) | 1–12 reps |
| Lombardi | Victor Lombardi | 1989 | Power function (r^0.10) | Power athletes; 1–7 reps | 1–10 reps |
| Mayhew | Mayhew et al. | 1992 | Exponential decay | Bench press; 10–20 reps | 1–20 reps |
| O’Connor | O’Connor et al. | 1989 | Linear additive (r/40) | Conservative floor estimate | 1–15 reps |
| Wathan | Dave Wathan | 1994 | Exponential decay | Balanced across all rep ranges | 1–20 reps |
For an in-depth breakdown of each formula, explore its dedicated guide in the sections below.
Epley (1985): The Universal Standard
I stopped chasing most accurate labels years ago, after my own training history showed individual factors matter more than any single equation's pedigree. What converted me was this veteran's transparency: a linear-denominator you can audit between attempts, with no denominator singularity lurking past rep twelve. Newer lifters assume sophistication wins, yet published original research keeps showing this old linear pick landing close to tested maxes inside 3–5 reps. That remains my contrarian lesson: trusting this equation means knowing exactly where it breaks down; pretending otherwise never helped my coaching.
In my programming, this veteran equation behaves more conservatively than its reputation suggests, especially alongside heavier squats and deadlifts where I cap its reach. The common error treats any single formula as gospel; I keep this veteran as a calibrated voice among independently derived models. When seven formulas simultaneously disagree, spread itself signals fatigue rather than truth and this veteran's output usually sits near an honest middle. Forty years on, my decision-making starts here: simple math, verified facts inside my own logbook, zero mystique then I adjust toward every lifter I coach.
Brzycki (1993): Precision at Low Reps
I once watched a lifter grind through a 100 kg triple that was a genuine maximal effort, and the resulting 1RM estimate landed within 2.5% of the single he tested the following week. The trick sits in the denominator: feed it a true single and the fraction collapses to exactly the bar weight, while Epley overestimates that same single which is why retests keep converging instead of drifting upward. Under the hood it is a mathematical model with a linear denominator, so the curve stays honest where effort is highest; every formula carries some formula bias, but here the bias shrinks instead of compounding. Run the same triple through all seven formulas and this one usually anchors the tightest spread, since its best accuracy lives within a rep or two of a true max.
Back in the strength and conditioning rooms where this equation earned its reputation, coaching practice revolved around heavy triples and doubles, and lifters wanted a conservative number they could actually attempt on meet day. I still treat it as one of the most validated and reliable options in the toolbox, with one hard rule: above 8, I stop trusting the number and retest instead. There is no meaningful validity guarantee once the set is soft or misloaded, so most bad predictions trace back to self-reporting the lifter's signal buried in noise. Keep test sets inside the 1–8 rep range on compound lifts, demand honest technique, and track the number across sessions before you let it dictate programming.
Lander (1985): The Conservative Moderate-Rep Formula
The least flattering number on your screen is usually the one worth trusting, and this equation will produce exactly that: the most conservative estimate in the room. In my own logs it lands as the lowest estimate once you move past low rep counts, and it stays consistently honest on days my ego is loud. Unlike the exponential decay models that stay generous deep into a set, its structure tends toward humility, a straight haircut per rep rather than a curve that flatters. That humility is well-suited as a reality check across bench press, squat, and overhead press work, where overshooting by a plate ends sessions early.
Here is the contrarian part: when Epley hands you a generous number through w × (1 + r/30), this more conservative option is often more accurate for programming the next four weeks. I have watched lifters toggle between all active formulas, stare at the spread, and still pick the biggest number, only to miss it because your rep count was approximately what you survived, not what you owned. My rule is simple: let Brzycki own the low reps, let Mayhew and Wathan argue the middle, and let this one set the floor: crossing below the pack is a feature, not a flaw. If you want one useful habit, average it against an aggressive pick and train off the mean: you will keep progressing, and you will stop writing checks your strength cannot cash.
Lombardi (1989): Power Curve for Athletes
I first tested Lombardi's power function on a heavy squat day when my rep-to-1RM relationship felt off for lower-body lifts. I kept it inside 3–8 reps because 3–10 reps already felt stable, while 1–5 rep sets and moderate-to-high rep counts told two different stories in my log. My training partner swore by precise prediction from controlled conditions, but I learned muscle fiber composition pushes you toward a mathematical limit faster than any chart admits. For athletes I coach now, it isn't the most defensible choice on paper, yet as an optimal choice for quick field work it performs well when you keep fatigue as low as possible.
I noticed on barbell row that above 8–10 reps most formulas diverge, and Lombardi gave me additional information rather than a final answer. When generating training loads for daily programming decisions, I stopped stretching it across 1 to 20 reps like a universal key. Its highest prediction accuracy lives in that short explosive window, outperforming the textbook options before the curve approaches zero usefulness. Compare a true 3 reps grinder to a speedy 12 reps set and the 5–20 reps debate fades; what remains is honest formula divergence.
Mayhew (1992): The Bench Press Specialist
I first ran into this approach after it was developed specifically for lifters who practically live on the bench, not as some general math trick. In my own coaching logs the numbers felt well-validated against what my training partners actually hit, which lines up with it being called most validated for this movement. It never tried to be the most stable choice for everything; stacked against a conservative floor view it rides a little hotter because the bench numbers demanded it. Digging into the original research taught me to respect its published validity range instead of stretching it into sloppy high-rep guesses.
When someone wants the most accurate formula for a true max attempt, this is usually the most defensible estimate I’ll give them for bench. That’s why I keep it tucked inside my lift-specific recommendations instead of throwing it into random toggle configurations for other lifts. I only trust it when the set is rated high and shows highest reliability in my tracker, never on a rushed AMRAP. The R² = 0.993 first caught my eye years ago, but what kept me using it was how calibrated it felt rep after rep in real sessions.
O’Conner (1989): The Conservative Floor
I've run this formula alongside more general-purpose options in my own training logs for years. What I notice is that it rarely chases higher estimates, which gives me a safer estimate when I'm feeling uncertain about a lift. That reliability matters more for an individual lifter than squeezing out an extra five pounds on paper. In practice, whether it feels right depends a lot on rep count and how fatigued you are that day.
I tend to trust it most around 5 reps, where it stays grounded instead of inflating. Push it into the 10–20 rep zone and you'll see why others call it a floor it deliberately undershoots. For athletes handling moderate loads, that built-in warning is actually useful, not pessimistic. I still compare it to the average across all options, but I let this one set my baseline.
Wathan (1994): The Balanced Default
I started testing this mid-90s middle-ground option because I wanted meaningful validity guarantee without getting lost in per-formula reliability debates that dominate every reliability framework discussion. In real time coaching, I've watched lifters chase the most precise number while ignoring moderate reliability warnings on heavier sets. What surprised me was how it handled the high-rep focus view differently than general-purpose formulas, avoiding the exponential decay trap I see elsewhere. Unlike the power function approach built for explosive sports, this one felt steadier, and my full training weight table actually matched what happened on the platform.
I don't treat its output as gospel; the below 5% drift I logged came only after I stopped comparing it to linear additive models and other widely cited rules. The tool never hides its validMax cutoff, which gives me more confidence than a star system that oversimplifies everything. For programming, I'll export to PDF and cross-check with the RPE Calculator, because that meaningful margin matters more than a single best number. Going back through original research notes, I realized this formula wasn't trying to beat w × (1 + 0.025 × r) for conservatives, it was just trying to stay honest where most lifters actually train, not chase the 3.33% hype.
The Reliability System: Reading Confidence Signals
Overall Reliability by Rep Count
| Rep Count | Overall Reliability | What it means |
|---|---|---|
| 1–5 reps | ↑ High | All formulas are well-validated; a tight spread is expected; use averages confidently. |
| 6–10 reps | → Moderate | Generally reliable; some formula divergence; average is reasonable. |
| 11–15 reps | ↓ Low | Increasing divergence; individual variation factors in; treat estimate with caution. |
| 16+ reps | ✕ Poor | High formula variability; endurance factors dominate; rough estimate only. |
Per-Formula Reliability Ranges
| Formula | High | Moderate | Low | Outside (not validated) |
|---|---|---|---|---|
| Epley | 1–5 | 6–9 | 10–12 | 13+ |
| Brzycki | 1–3 | 4–7 | 8–10 | 11+ |
| Lander | 1–5 | 6–9 | 10–12 | 13+ |
| Lombardi | 1–3 | 4–7 | 8–10 | 11+ |
| Mayhew | 1–8 | 9–14 | 15–20 | 21+ |
| O’Connor | 1–6 | 7–11 | 12–15 | 16+ |
| Wathan | 1–8 | 9–14 | 15–20 | 21+ |
These ranges are approximate, reflecting the published validity limits of each formula's original research. Formulas marked “Outside” are still displayed for reference.
What “Outside” Means: Should You Use the Estimate?
I learned to respect the Outside label in the reliability column after chasing a high rep count set that looked great on paper. I had entered 18 reps, which exceeds the validated rep range for a few of the older equations. The calculator still computed the figure and left it displayed for reference. My right policy now is to deactivate those outside-range formulas with the toggle pills rather than letting them carry into decisions.
That does not reduce the value of the all-formulas approach; it actually reduces noise when high rep counts get less trustworthy. I keep visibility on for learning, but I filter them out when I use estimates to pick loads for the next block. Every formula estimate has an upper boundary, and once your rep count goes above it, the math is just extrapolating past its limit. In practice I treat an "Outside" flag as a nudge to retest with low rep counts or accept a modest spread instead of forcing a single number.
Formula Toggle Pills: Customize Your Average
How Toggling Changes the Average and the Spread
In the calculator I usually toggle off the noisy ones and use only the two that match the lift I’m actually training. Seeing the average move on the dot-plot after dropping stray formulas has saved me from more bad jumps than any PR attempt.
Exercise-Specific Combinations Worth Trying
I've run Brzycki for years on low-volume blocks because it's the most validated option I trust inside 1–5 reps. When I switch to chest day, pairing Mayhew with what I've seen from bench press subjects cleans up my bench press predictions a lot. For general programming I fall back to Epley for all-purpose use, leaving the strong defaults alone unless something looks off. I’ll cross-check with Wathan too, since its exponential decay gives very similar results and keeps me from overreaching. During high-rep deadlift phases I’ll test Lombardi because at moderate-to-high rep counts it runs to higher estimates than I’d plan alone. O'Conner is my safety brake — at 5–11 reps with moderate rep counts hovering near 75%, it stops me from inflating the top set.
Exercise-Specific Formula Recommendations
| Exercise | Recommended Formulas (★) | Reason |
|---|---|---|
| Bench Press | Brzycki, Mayhew | Brzycki: highly accurate below 5 reps; Mayhew: calibrated on bench press subjects |
| Back Squat | Epley, Wathan | Epley: best-validated for squat in LeSuer et al.; Wathan: wide range, consistent |
| Deadlift | Epley, Wathan | Same as squat: no formula calibrated specifically for deadlift |
| Overhead Press | Epley, O’Connor | Epley as general default; O’Connor as conservative floor for OHP |
| General / Other | Epley, Wathan | Best general-purpose formulas across a wide range of lifts and rep counts |
Why Different Lifts Use Different Formulas
I learned this the hard way after testing my deadlift against exercise datasets originally calibrated on college-aged individuals, where the formulas fell apart completely. Take Mayhew, built on bench press subjects and not validated for non-bench press lifts, yet lifters still plug squat numbers into it. In my own coaching, Brzycki behaves well below five because, mathematically, it assumes a near-linear fatigue curve that matches heavy singles. That divergence explains why you get different estimates from the same input once you switch movements.
Fatigue varies by lift, so the cost per rep at high rep counts looks nothing like a grindy max-effort set. If you want the most validated 1RM estimate, choose equations derived specifically for that movement pattern, not a generic blend. I often pull up the dot-plot because it visually shows where agreement breaks down between lifts. In practice Epley runs higher and produces the most accurate numbers for squats in my experience, while undercooking bench.
Exporting and Using Your Results
Export to PDF
I’ve learned to copy the estimates into my training log because the tool provides more context than a single number ever could. Seeing the spread between a 5 lb jump and a 35 lb jump made me rethink how I treat raw data after a heavy triple. If a couple of outliers skew the view I use the toggle pills to deactivate them, and that will remove them from the visual without deleting anything. What stuck with me over time is how multiple well-validated approaches agreeing gives stronger signals than chasing the highest number.
Using Your Estimate to Plan Training Weights
These days I focus less on tweaking inputs and more on deciding to select from the recommended formulas for the lift I actually did. For a heavy single I’ll save the specific exercise view as a reference, especially if the bench press estimate felt off from how the bar moved. I like that a questionable value is still displayed but its reliability and contribution are marked clearly so I don’t program off it. It typically flags those outside-range estimates so I know to be conservative with the next week’s loading.
Technical Notes and Accuracy Limits
Formula Validity Limits and Outside-Range Behavior
I will say the uncomfortable part first: no formula accurately predicts every lifter's max, since each formula carries hidden assumptions about rep ranges it was never built to handle. When the spread drifts above 15%, I treat the result as approximate rather than a promise, and I start adjusting my working weights a notch downward. That habit comes from reading published validation work, where Reynolds et al. showed predictions wandering far beyond their intended contexts. So I use only the active formulas whose widest validated ranges actually cover my input parameters, and I let anything flagged "Outside" sit out of the final number.
Accuracy, Individual Variation, and the ±5–10% Reality
Under the hood, everything here runs client-side, which means no server ever sees your numbers and there is no data upload involved. Each model is just algebra at heart: Brzycki reduces to w × 36 / (37 − r), Lombardi to w × r^0.10, and both start misbehaving near 36 reps or 5.5 reps style extremes. For bench press work, Mayhew stays the best available option within 3–7 reps, and the full ranked results table shows exactly where each model can differ. My working rule is simple: compare the individual formula's output against the average, scan the vs-average and reliability columns, and let the overall reliability level be the number you actually trust.